

Forecasters expect the money to reach charities much slower than the headlines suggest. Here's the map behind the number, and how you can build your own on Radiant, Metaculus’ visual mapping tool.
The Anthropic and OpenAI IPOs are likely to create thousands of newly liquid millionaires, and a lot of them plan to give. How much of this expected giving will actually reach the philanthropic ecosystem, and are those organizations prepared to absorb it?
Colloquially, this has come to be known as the AI IPO windfall, and if some of the current predictions come to pass, it could change the shape of philanthropy for years to come.
Forecasting the AI IPO windfall
Our forecasts currently show over $100B total pledged.
But, as our forecasters have noted, this likely won’t translate into immediate actual money in the bank. They expect only about $25.7B total will actually land in charities within 4 years of shareholders being able to sell after the lockup period ends.
Projected figures for windfall are high but vary widely. Nan Ransohoff says people can expect $37B or more per year from this “third wave” of American philanthropy; George Weiner projects $12-32B will go into donor-advised funds (DAFs) and trickle out through grants; Giving What We Can expects about $15B in donations a year; and Celia Ford claims the 7 Anthropic co-founders alone could contribute $37.9B.
Our forecast, including assumptions, probability distributions, and how everything connects, lives in The IPO Windfall map on Radiant, our visual mapping platform for collaborative scenario modeling.
In this map we address the major uncertainties around this situation:
- When do the IPOs actually happen?
- What will the companies be worth when employees can first sell their shares?
- How long are the lockups, and how much do equity holders sell when they expire?
- What share of the newly wealthy will give, and how much will reach organizations in the first year rather than remain in a donor-advised fund?
These are the kinds of questions forecasting can help us navigate.
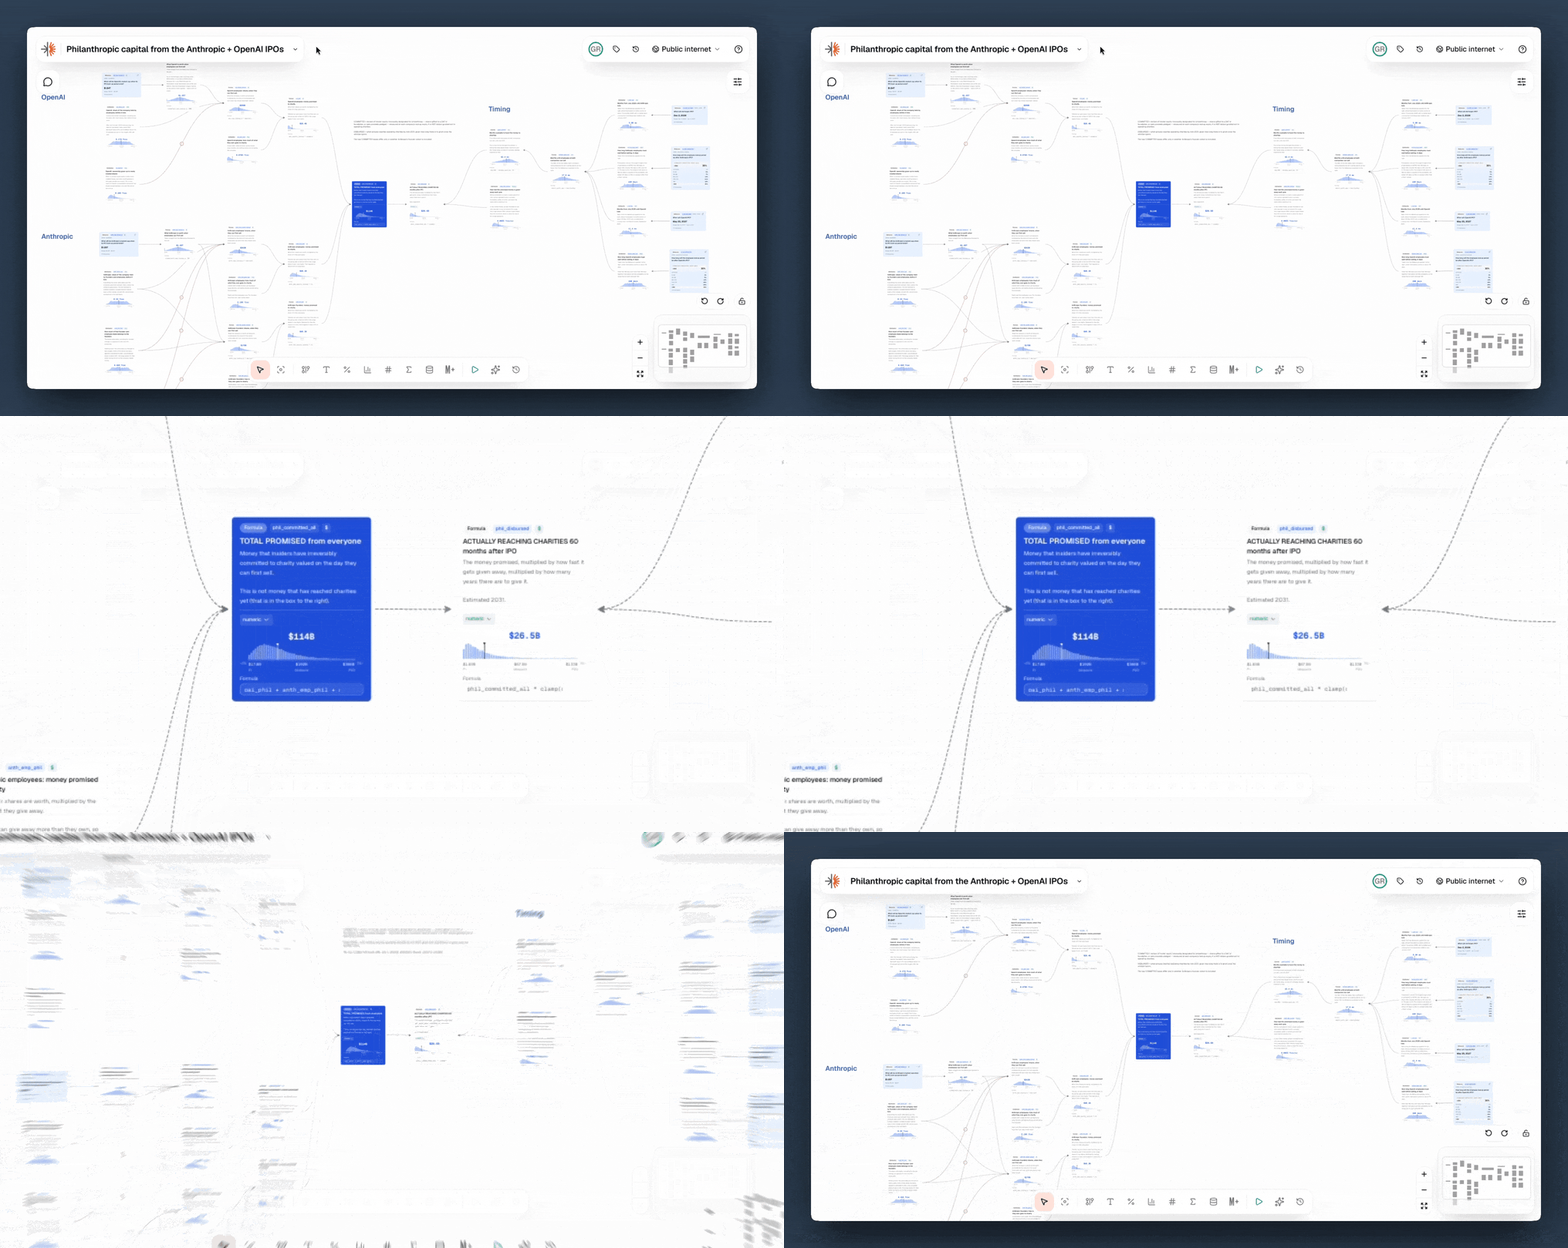
How big is the windfall?
The main node, in the center, brings together the factors that determine the estimate: IPO timing, company valuations, lockup periods, equity ownership, how much equity holders liquidate, and how much they give away. The map makes those connections visible, so you can see what the estimate depends on.
Metaculus forecasts are part of the map. Where a node corresponds to a live Metaculus question, the map draws on those forecasts. Where the model rests on an assumption, we aim to make that explicit so you can more easily find where you disagree. In this case, our forecasters have estimated that when their lock-up periods end, Anthropic will have a market cap of $1.88T (50% PI [$1.41T, $2.51T]) and OpenAI of $1.84T (50% PI [$1.35T, $2.35T]). Estimates around lock-up period timing center around 180 days for both companies, after Anthropic’s forecasted IPO date around December 7, 2026 and OpenAI’s on May 25, 2027. Pro Forecaster Zaldath writes:
The exact date used here will be crucial. 180 days is the standard for an employee lock-up period (although SpaceX had a faster schedule). In any case, it should be at least a month or two, and at the latest around six months after IPO. Given fast valuation growth over time so far, plus the added demand from IPO, going well above 1 trillion in the post-IPO months seems likely.
The map is alive. The forecasts (light blue nodes) feeding it will update as filings and announcements come in, and the formulas update with them. If the IPOs take longer than expected or something happens that massively adjusts expected valuations, the map updates instead of going stale.
The map is an aggregation, but you can change the story. The map pulls forecasts and stated assumptions into one inspectable picture of the uncertainty. You can adjust the assumptions on the map to test different scenarios and see how these affect the result.
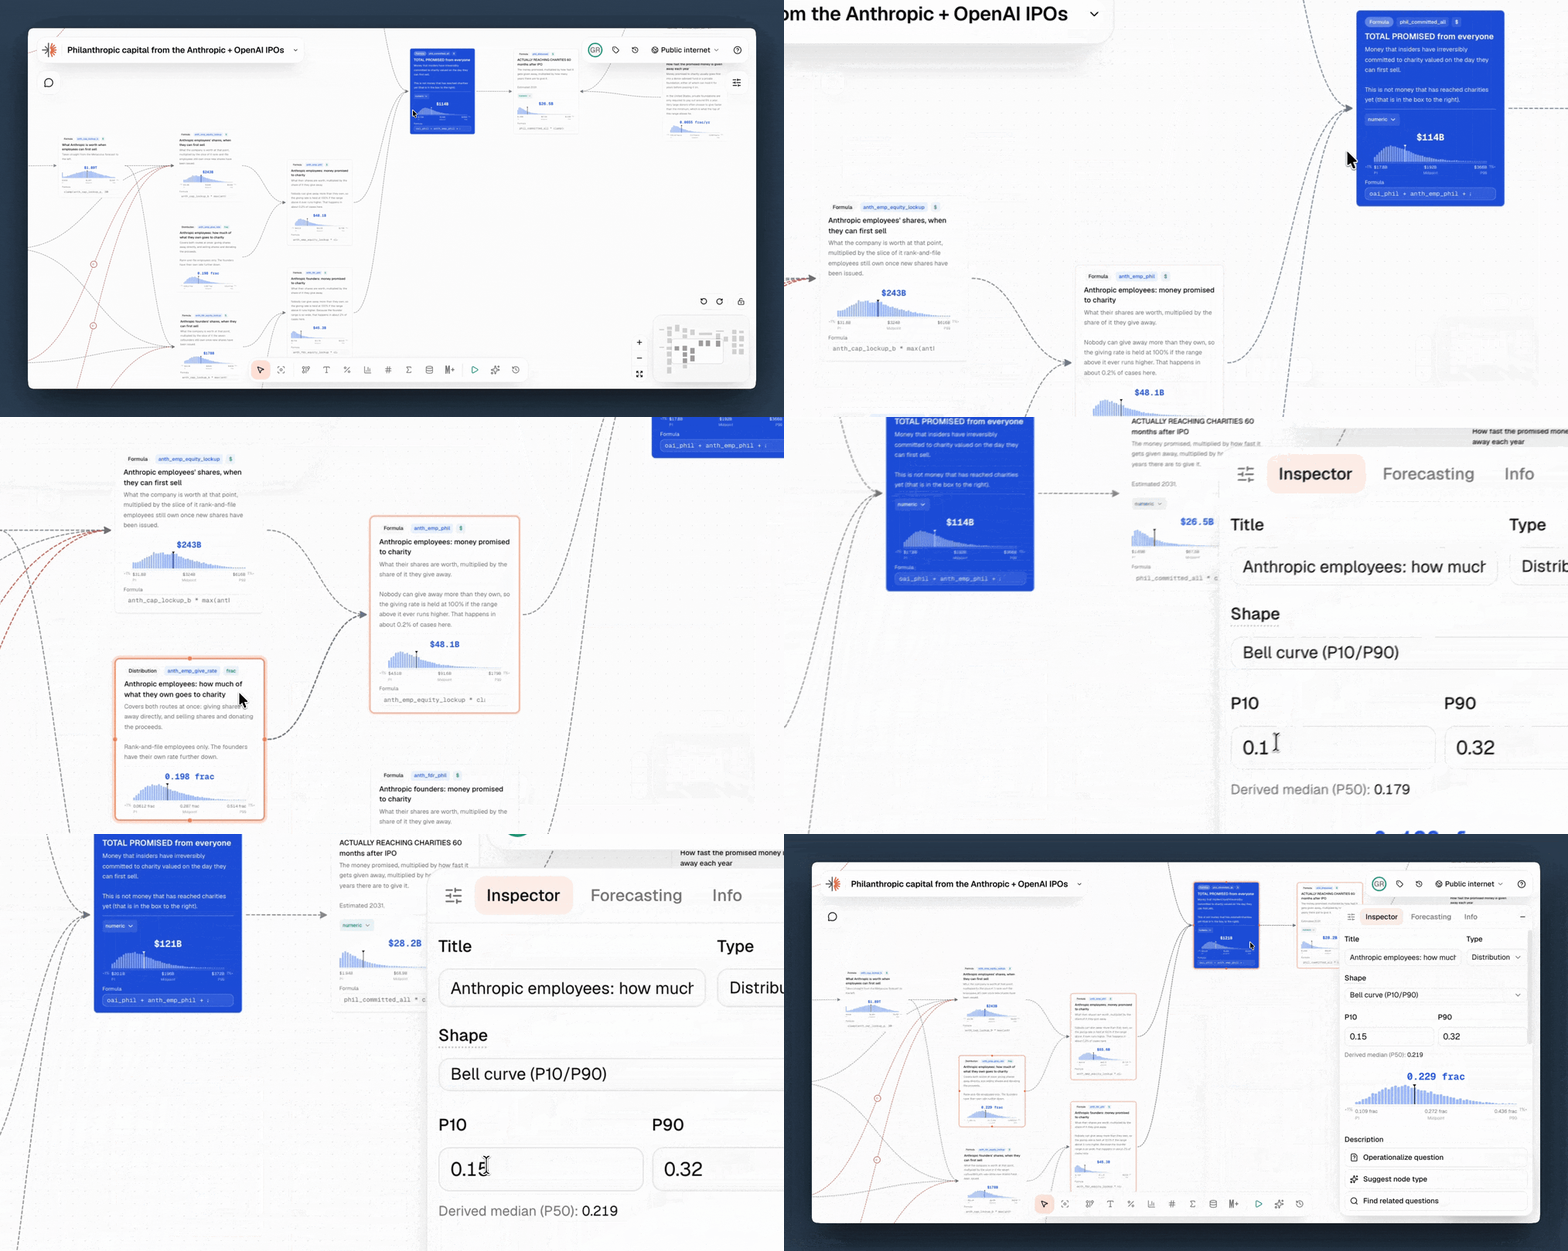
You can fork the map. Find the node you trust least and set it to what you believe. If you think $24.5B is too low, find the node where you part ways with us (maybe more founders honor the 80% pledge, or lockups end sooner?), change it, and tell us why in the comments.You can also add your forecasts to the questions in the AI Lab IPOs series to contribute to the community prediction.
What’s next
This map asks, “How much?” Our next map (coming soon!) will ask “Where to?” We’ll be looking at the expected distribution of the windfall across cause areas, from AI safety and global health to climate, biosecurity, animal welfare, and personal causes.
We also plan to consider political giving and money that remains in donor-advised funds. It’s a harder modeling problem with more room for disagreement, which is exactly why we want to do it in public.
We’ll continue adding questions to the AI Lab IPOs series to inform this work. If you’ve been tracking these IPOs closely, or you know something about how tech wealth turns into philanthropy, we’d welcome your perspective.
Explore the Radiant Map. Find the assumption you trust least and tell us in the comments what you would change and why.
Or add your forecasts to the AI Lab IPOs series to improve the community predictions behind the model.